Amazon makes 2.5 million price changes per day. The product you are looking at right now could have been 30% cheaper last Tuesday — and could be 30% cheaper again next Tuesday. Without seeing the price history you have no way of knowing where today's price sits in that cycle.
That information gap is not accidental. Amazon deliberately does not show price history on product pages. Every other piece of relevant information is there — reviews, Q&A, specifications, seller ratings, shipping times. Price history is conspicuously absent. The reason is simple: shoppers who see that a product was 30% cheaper three weeks ago do not click "Buy Now" — they wait. Shoppers who do not see that history click "Buy Now" today.
This guide shows you exactly how to close that information gap. You will learn the three best free tools for seeing Amazon price history, how to read price history properly, the six signals that tell you whether to buy or wait, and the five-step system that prevents you from ever overpaying on Amazon again.
To see Amazon price history for free in 2026, install Zroppix from the Chrome Web Store. Open any Amazon product page and click the icon — you get 90 days of price history plus an instant BUY or WAIT verdict in 5 seconds. No account required. Alternative free tools include CamelCamelCamel and Keepa.
Why Amazon Hides Price History From You
Before getting into the tools, it helps to understand why this problem exists in the first place. Amazon is not just neglecting to show you price history. They are actively making the decision not to.
Here is what we know about how Amazon's pricing actually works:
Amazon's pricing algorithm adjusts prices in real time based on demand signals, competitor pricing across the web, current inventory levels, time of day, day of week, your browsing history, your device type, and dozens of other inputs. The price you see is one of dozens of prices that product will cycle through over the coming weeks.
Research tracking 100 popular Amazon products over 90 days found that 54% of products are priced above their own 90-day average at any given moment. More than half of what you see on Amazon right now is overpriced relative to what it was and will be again. That is not a coincidence — it is the algorithm working exactly as designed.
If Amazon displayed a small price history chart next to every product, two things would happen:
- Shoppers would immediately see when current prices are above average and delay their purchase
- The psychological power of crossed-out reference prices and "sale" badges would collapse
Both outcomes hurt Amazon's revenue. So the price history stays hidden. Third-party tools fill the gap that Amazon deliberately created.
The 3 Best Free Tools To See Amazon Price History in 2026
There are three serious options for seeing Amazon price history for free. Each has different strengths and use cases. The right choice depends on what you actually want to do with the data.
| Feature | 🛡️ Zroppix | CamelCamelCamel | Keepa |
|---|---|---|---|
| Free forever | ✓ | ✓ | Free tier limited |
| BUY or WAIT verdict | ✓ | ✗ | ✗ |
| Works directly on Amazon page | ✓ | Separate website | ✓ |
| Time to get verdict | 5 seconds | 2-3 minutes | Manual chart reading |
| 90-day price history | ✓ | ✓ + years | ✓ + years |
| Overpay risk score | ✓ | ✗ | ✗ |
| What % paid less | ✓ | ✗ | ✗ |
| Email price alerts | ✓ | ✓ | ✓ |
| Account required | No | Yes (for alerts) | Yes |
| Best for | Quick decisions | Deep research | FBA sellers |
Option 1 — Zroppix (Best for Everyday Shoppers)
Zroppix is a free Chrome extension that shows Amazon price history with one critical difference from every other tool: it does not just show you data — it tells you what to do with it.
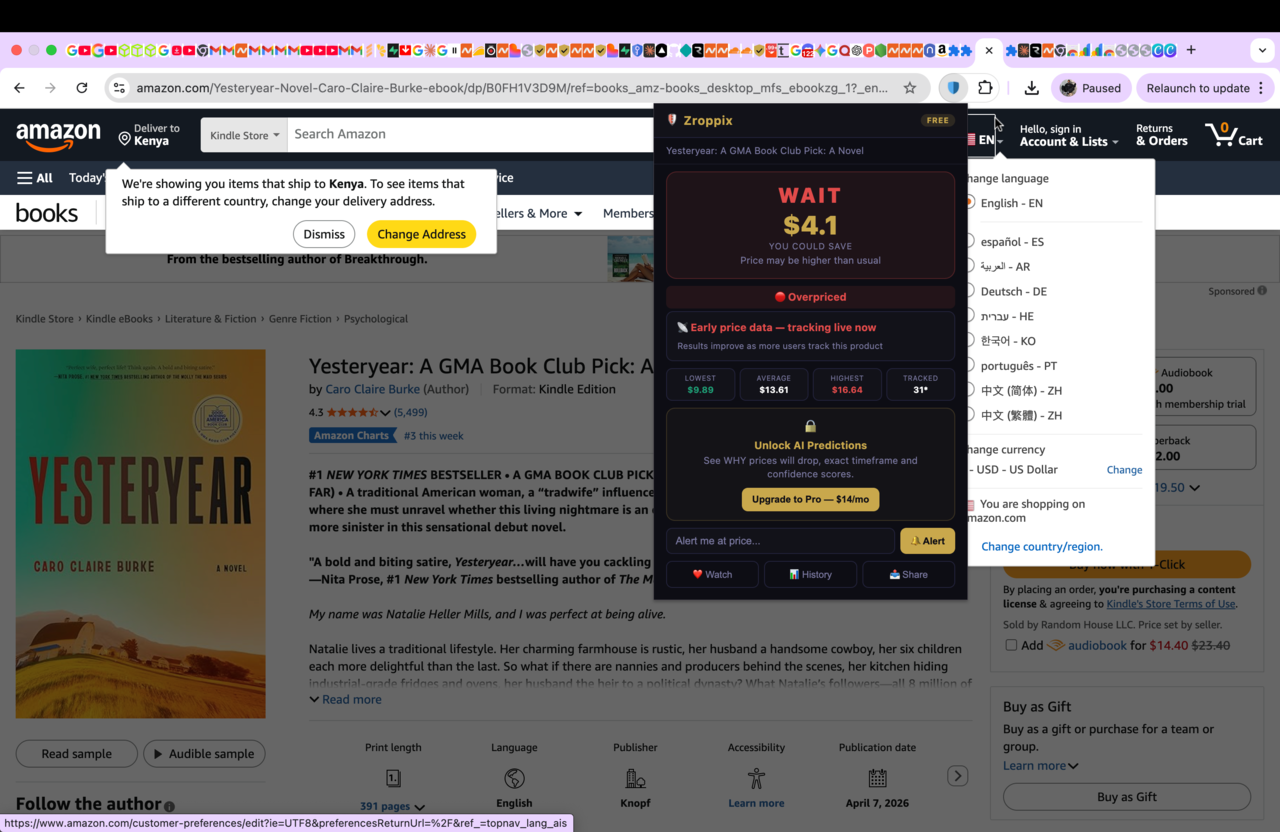
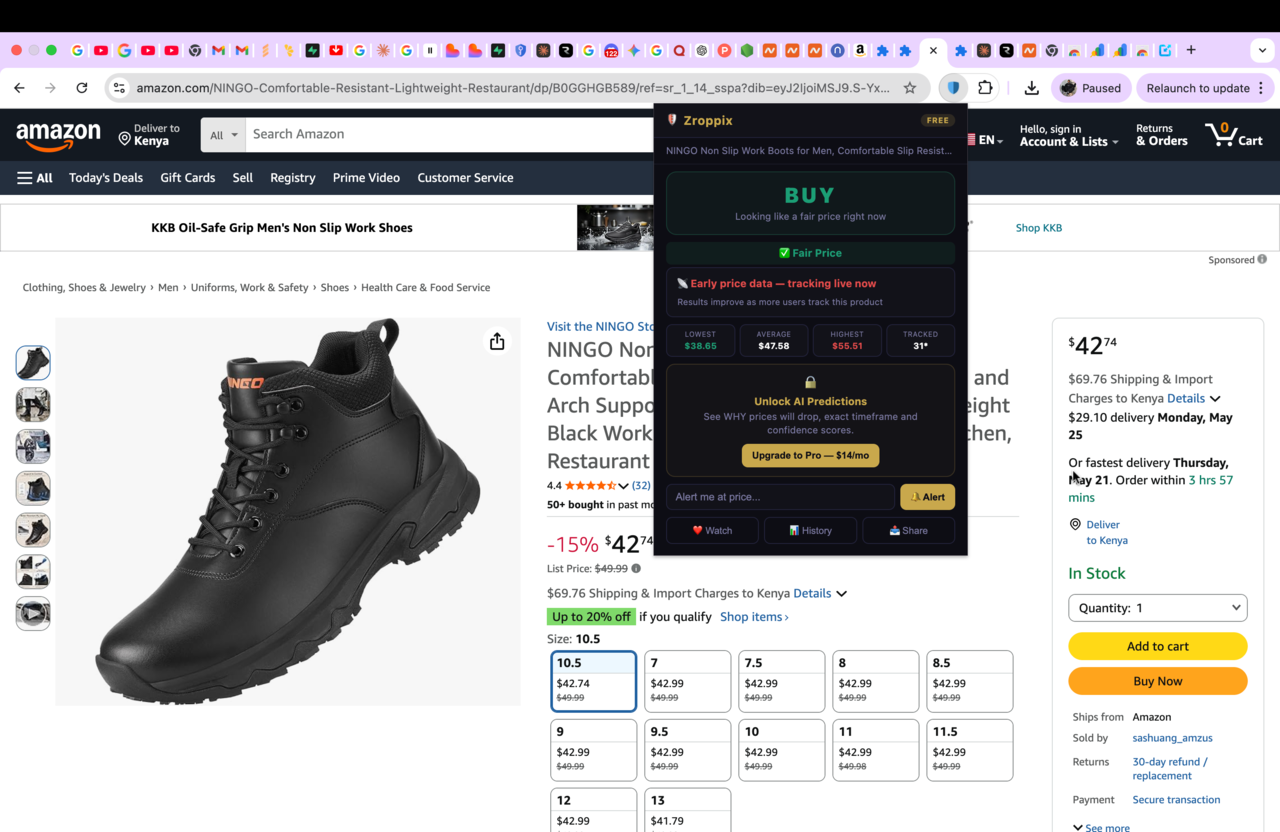
When you click the Zroppix icon on any Amazon product page, you see in 5 seconds:
- BUY or WAIT verdict — based on whether the current price is above or below the 90-day average
- Lowest, average, and highest price over the past 90 days
- Overpay risk score from 0 to 100 telling you how aggressively the current price exceeds the historical norm
- What percentage of previous buyers paid less than the current price
- Potential savings amount if the verdict is WAIT
- Email price alert option — set a target price and get notified instantly when it drops
The whole interaction takes 5 seconds. No new browser tab. No chart to interpret. No account to create. Free forever.
Option 2 — CamelCamelCamel (Best for Deep Historical Research)
CamelCamelCamel has been tracking Amazon prices since 2008. For popular products, it has years of price history data — sometimes going back a decade or more. That depth of data is genuinely valuable when researching big purchases.
How to use it: go to camelcamelcamel.com, paste any Amazon product URL into the search box, and you get a full price history graph going back as far as their data exists. You can set price drop alerts via email.
The limitations: it is a separate website, so you have to leave Amazon, paste the URL, wait for the page to load, then interpret the graph yourself. There is no BUY or WAIT verdict — you have to look at the line and figure out whether the current price is high or low relative to history. For shoppers who already know how to read price history charts, this works fine. For everyone else, it adds friction without adding clarity.
Option 3 — Keepa (Best for Amazon FBA Sellers)
Keepa is the most data-rich of the three tools. It is a Chrome extension that embeds detailed price history charts directly on Amazon product pages, plus shows sales rank history, multiple seller offers, Buy Box price changes, and review tracking.
This depth is essential for Amazon FBA sellers and power users who need to make sourcing decisions based on years of historical data. For regular shoppers, the interface is overwhelming — there are too many lines on the chart, too many tabs, and too many data points to easily interpret.
Keepa's free tier shows basic price history. Their paid tier ($19/month) unlocks advanced features like sales rank tracking and detailed seller data — useful for resellers, unnecessary for shoppers.
Skip the chart interpretation
Get 90 days of Amazon price history plus an instant BUY or WAIT verdict in 5 seconds. Free Chrome extension — no account needed.
How To Read Amazon Price History Like a Pro
Seeing the price history is only half the value. Knowing what the data actually tells you is the other half. Most people look at a price history chart, register vaguely that the price is "around average" or "kind of high," and move on. That is not enough to make a good buying decision.
Here are the six signals to look for whenever you check Amazon price history.
The 90-day average vs current price
This is the single most important signal. If the current price is above the 90-day average, you are paying more than the typical buyer paid recently. If it is below, you are getting a deal. Anything within 5% of average is neutral.
The all-time low (or 90-day low)
This shows you the floor — what the product has actually sold for in the past. If today's price is close to the 90-day low, that is a strong buy signal. If today's price is significantly above the low, expect the price to return to that floor at some point.
Price volatility — how much it moves
Look at the gap between the lowest and highest price over 90 days. A product that fluctuates between $40 and $80 is highly volatile — waiting is almost always worthwhile. A product that stays within $5 of one price is stable — waiting saves less.
How often it drops
Does the chart show frequent drops every few weeks, or has the price barely moved in months? Frequent drops mean waiting is reliable. Rare drops mean the current price may be the best you will see for a while.
Seasonal and event patterns
Many products have predictable seasonal patterns. Electronics drop before Black Friday and Prime Day. Outdoor gear drops in autumn. Kitchen appliances drop around major holidays. If a known sale event is 2-4 weeks away, that is a wait signal.
The trend direction
Is the price trending up, down, or sideways over the past 30 days? Recently rising prices often mean a sale event is approaching (sellers inflate before "discounting"). Recently dropping prices often signal that more drops are coming.
Real Case Study — The KitchenAid Mixer Example
$340 displayed price vs $224 actual fair price
A shopper was about to buy a KitchenAid stand mixer on Amazon. The listing showed $340 with a "15% off" badge. Without price history, this looked like a reasonable purchase.
They checked the price history first. The data showed:
- 90-day average: $261
- 90-day low: $224 (just 8 weeks earlier)
- 90-day high: $340 (today)
- Current overpay risk: 87/100
The "15% off" badge was calculated from an inflated reference price. The product was actually at its 90-day high, not at a discount. The verdict: WAIT.
They set a price alert at $230 and waited. Five weeks later, the price dropped to $224.
How To See Amazon Price History on Your Phone
Most price history tools were built for desktop browsers. Checking on your phone is possible but requires different approaches.
For iPhone
Chrome extensions do not work in mobile Safari or Chrome on iOS. To check Amazon price history on iPhone, copy the Amazon product URL, switch to Safari, go to camelcamelcamel.com, and paste the URL into the search box. You will see the full price history graph on mobile.
Keepa has an iOS app that lets you scan barcodes or paste URLs to see price history. The interface is more complex than CamelCamelCamel but the data is deeper.
For Android
Android users have an extra option: install Kiwi Browser (a Chromium-based browser that supports Chrome extensions). You can install Zroppix directly inside Kiwi Browser and use it on Amazon mobile pages the same way you would on desktop.
Alternatively, use the same approach as iPhone — copy the Amazon product URL and paste it into camelcamelcamel.com via any mobile browser.
The simplest mobile workflow
If you primarily shop on your phone, the cleanest workflow is: when you find a product you want to buy, paste the URL into camelcamelcamel.com to verify the price. If you also use a laptop, install Zroppix there and check the same product before buying — the desktop experience is significantly faster for verification.
The 5 Most Common Mistakes When Reading Price History
Even with the right tools, people make consistent mistakes interpreting price history data. Avoid these and you will make significantly better buying decisions.
❌ Mistake 1: Only looking at the lowest price ever
The all-time low might have been a Black Friday lightning deal that lasted 4 hours and never returned. Use the 90-day average as your benchmark, not the absolute floor.
❌ Mistake 2: Ignoring volatility
A 5% discount on a stable product is meaningful. A 5% discount on a volatile product that swings 30% regularly is meaningless. Always consider how much the price normally moves before deciding what counts as a deal.
❌ Mistake 3: Trusting the "was" price on the listing
Amazon's crossed-out reference price is often inflated specifically to make the current price look like a discount. Always compare to the 90-day average from a price tracker, not to the seller's claimed "was" price.
❌ Mistake 4: Buying just because the sale badge says urgent
Lightning Deal countdown timers create urgency around prices that often end at or above the 90-day average. Research found 68% of Lightning Deals end at above-average prices. Check the history before reacting to the countdown.
❌ Mistake 5: Not setting an alert when you decide to wait
The biggest mistake is checking the history, deciding to wait, and then forgetting about the product entirely. Always set a price alert at your target price so you know the moment it drops — otherwise you just lose track and never buy.
The 5-Step System for Using Price History Before Every Purchase
Knowing how to read price history is only useful if you actually apply it consistently. Here is the exact system that turns price history checking into an automatic habit.
Install Zroppix once — never set up again
30-second one-time install from the Chrome Web Store. No account, no signup, no configuration. Once installed, it is ready every time you visit Amazon.
Check before every purchase over $20
Before clicking "Add to Cart" on anything over $20, click the Zroppix icon. 5 seconds. You see the verdict immediately. No exceptions — the habit is what makes this work.
If BUY — purchase with confidence
The current price is at or below the 90-day average. You are not overpaying. Buy without hesitation and move on with your day.
If WAIT — set a price alert at your target
Enter the price you would be willing to pay (typically the 90-day average or slightly below). Add your email. Zroppix monitors the price hourly and emails you the moment it drops to your target.
Buy when the alert hits — at the right price
You get an email when the price drops. Open the link, buy at your target price, and you have saved real money without spending any extra effort or attention. The system runs itself once set up.
Apply this to every purchase over $20 and you will save roughly $200-500 per year. Apply it to bigger purchases — laptops, TVs, appliances — and you will save significantly more on each individual transaction.
🚨 The most expensive mistake is checking price history once, deciding to wait, and then never coming back. Always set an alert. The whole point of the system is making the right purchase happen automatically.
The Bigger Picture — Why This Matters
Amazon's pricing system represents one of the largest information asymmetries in consumer history. The company knows the entire price history of every product, knows the prices its competitors charge, knows your individual purchase patterns and willingness to pay, and uses all of that information to decide what price to show you. You see one number on a page.
Price history tools restore a small but meaningful piece of that asymmetry. They do not give you everything Amazon knows — but they give you enough to make informed decisions instead of blind ones.
The shoppers who consistently get the best prices on Amazon are not lucky. They are not patient. They simply have the data Amazon does not want them to have, and they use it every single time.
Install one of the three tools above — Zroppix, CamelCamelCamel, or Keepa — and you join that group. The savings compound month after month, purchase after purchase, year after year.
See Amazon price history in 5 seconds
Install Zroppix free. Get 90 days of price history plus an instant BUY or WAIT verdict on any Amazon product. No account needed. No credit card. Works in 10 seconds.
✦ 90 days of real price data · ✦ Instant BUY or WAIT verdict · ✦ Hourly price monitoring · ✦ Free forever
🛡️ Add to Chrome — It's Free