Price Tracking
Complete Guide · 2026
May 17, 2026
Track Amazon Prices Over Time: The Complete 2026 Guide
Amazon hides price history because showing you that something was cheaper last week would cost them sales. Tracking prices over time gives you the context Amazon deliberately removes — revealing whether deals are real, when prices typically drop, and exactly what you should pay. Here is everything you need to track Amazon prices effectively in 2026.
✍️ Zroppix Team
⏱ 13 min read
🔄 May 17, 2026
Every Amazon product has a price history. A record of exactly what it sold for every day going back months, sometimes years. Amazon does not show you this history — not because the data is unavailable, but because showing it would cost them money. Shoppers who know that a product was $40 cheaper three weeks ago are far less likely to buy it today at the higher price. Amazon's algorithm made 2.5 million price changes last Tuesday. Not one of them came with a notification to you.
Tracking Amazon prices over time completely changes the dynamic. You stop guessing and start knowing. You see immediately whether the current price is high, low, or average relative to what it has been. You understand which sale badges are genuine discounts and which are manufactured from artificially inflated reference prices. You know which categories drop at Prime Day and which do not. This guide covers every tool and every technique for tracking Amazon price history in 2026 — free, accurately, and in a way that actually helps you make better buying decisions.
⚡ Quick Answer
The fastest way to track Amazon prices over time in 2026: install Zroppix free. Open any Amazon product page and click the shield icon. You instantly see 90 days of real price history — the lowest, average, and highest price — plus a BUY or WAIT verdict based on where the current price sits in that history. No chart interpretation needed. For multi-year history going back further, CamelCamelCamel is the best free option.
What Tracking Amazon Prices Over Time Actually Reveals
Most shoppers look at the Amazon price they see right now and have no frame of reference for whether it is good. They see $279 for headphones and think: is that a deal? Is it overpriced? Should I wait? Without price history, the answer is always a guess. With it, the question answers itself.
📊
Whether the current price is actually good
When you see 90 days of history, you know immediately. If the 90-day average is $249 and the current price is $279 — that is an overpriced product. If the current price is $219 and the average is $249 — that is a genuine deal worth acting on. Price history removes all ambiguity about whether now is the right moment to buy.
🔄
How often and how much prices drop
Some products have volatile prices that swing $30-50 multiple times per month. Others are remarkably stable, only dropping during major sale events twice per year. Tracking history reveals which type your product is — so you know whether to set an alert and expect it to fire within days, or to wait for Prime Day months away.
🎭
Whether Amazon sale badges are genuine
Amazon's "Limited time deal" badges calculate discounts from a reference price that sellers can inflate before a sale. Tracking prices over time exposes this pattern — you can see exactly whether the "30% off" sale price is genuinely below what the product normally sold for, or whether it is just back to normal after an artificial pre-sale markup.
📅
The seasonal price patterns for your product category
Electronics follow predictable seasonal patterns. Amazon devices drop at Prime Day and Black Friday every year. Laptops hit their lowest in July-August and November. Kitchen appliances dip in January. Seeing multiple months of price history reveals these cycles — so you can plan purchases around the best times to buy rather than guessing.
54%
Products above 90-day average right now
2.5M
Price changes Amazon makes per day
$312
Average annual overpayment without tracking
56%
Amazon sale badges on products above their average
The Best Free Tools for Tracking Amazon Prices Over Time
How to Track Amazon Prices Over Time — Step by Step
Method 1: Zroppix (Fastest — Works on Amazon Directly)
- Install Zroppix free from the Chrome Web Store — 30 seconds, no account
- Open any Amazon product page (URL should contain /dp/)
- Click the gold shield icon in your Chrome toolbar
- The popup immediately shows: 90-day lowest, average, and highest price; BUY or WAIT verdict; overpay risk score; what percentage of buyers paid less than the current price
- If verdict is WAIT — set a price alert at the 90-day average price. If verdict is BUY — buy now at a historically fair price
Method 2: CamelCamelCamel (Best for Multi-Year History)
- Copy the Amazon product URL from your browser
- Go to camelcamelcamel.com
- Paste the product URL in the search bar and press Enter
- View the price history chart — you can adjust the time period from 3 months to "all time"
- To set a price alert, create a free account and click "Watch this product"
- Enter your target price and email address
How to Read Amazon Price History Data — What Every Signal Means
Once you have price history data — whether from Zroppix, CamelCamelCamel, or another tool — the key is interpreting what you see correctly. Most people look at a price history chart and do not know what to look for. Here is exactly what each signal means:
Current price near 90-day high
WAIT
The product is at or near the most expensive it has been in 3 months. The price has historically dropped from this level. Set a price alert at the 90-day average and wait — there is a very high probability it drops within 30-60 days.
Current price at or below 90-day average
BUY
The product is selling at a fair or below-average price relative to its own recent history. You are not overpaying compared to what other buyers paid recently. Buy with confidence — this is what a price alert firing looks like.
Price at 90-day low
BUY NOW
You are at the lowest price seen in 3 months. This is the best recent buying opportunity. Act now — prices at multi-month lows frequently recover within days. Do not wait for it to go lower unless you have specific intelligence about an upcoming sale event.
Price elevated for 60+ consecutive days
Review
If the price has been consistently high for 2+ months, the average itself may have shifted upward. This could mean new pricing from the manufacturer, increased demand, or supply constraints. Consider whether the 90-day average accurately reflects where the price will return to, or whether it will stabilize at the new higher level.
Price spike immediately before a sale badge
Fake Deal
Tracking history over time reveals a pattern: Amazon prices frequently increase 10-20% in the weeks before a "sale" event — then the "sale" price returns to what was previously the normal price. The percentage off badge is calculated from the inflated pre-sale reference, making the discount look larger than it actually is.
Regular price drops every 30-45 days
Wait for Cycle
Some products follow regular discount cycles — typically third-party sellers running promotions monthly. Tracking over time reveals the cycle clearly. If the product dropped 3 weeks ago and you are now near the cycle high, setting an alert means the next cycle low will trigger it within a few weeks.
Real Price Tracking Case Studies — What the Data Shows
📊 Case Study 1 — Sony WH-1000XM5
Sony WH-1000XM5 Wireless Headphones — 90-Day Tracking
The current price of $279 is $30 above the 90-day average of $249. The product reached $198 once during a flash sale 6 weeks ago. A buyer without price tracking sees $279 and thinks "these are $350 headphones selling for $279 — great deal." A buyer with price tracking sees $279 is 12% above the 90-day average — and sets an alert at $229. The information gap costs the first buyer $50.
📊 Case Study 2 — Amazon Echo Dot (5th Gen)
Amazon Echo Dot (5th Generation) — 90-Day Tracking with Prime Day Context
The Echo Dot is currently at list price — $50. Tracking shows the 90-day average is $38 because it dropped to $19 at last Prime Day. For someone buying today, the data says: wait. Set a target at $25 and expect it to fire at the next Prime Day (June 2026) when Amazon devices reliably reach their annual lows. The 4-6 week wait saves $31 on a $50 product — a 62% saving.
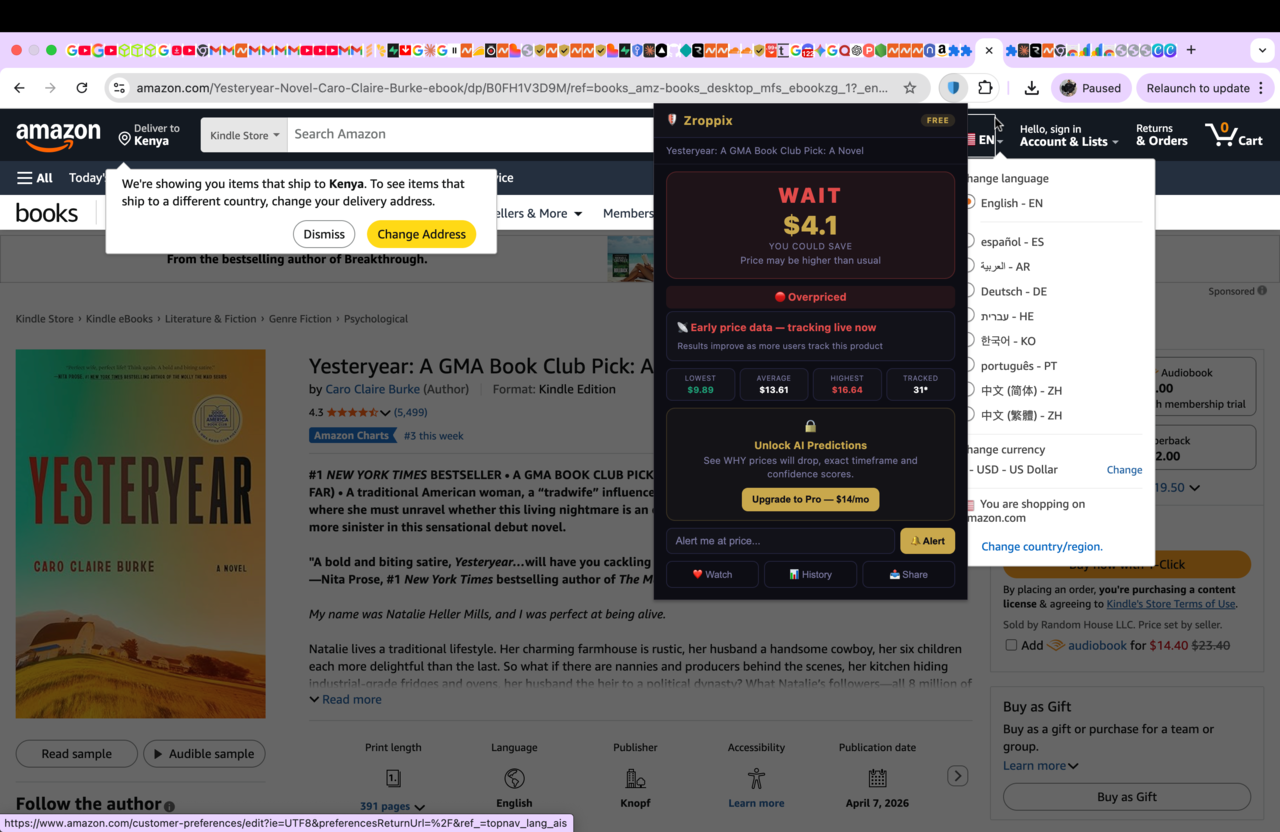
WAIT verdict. The 90-day tracking data shows the current price is above the historical average. Overpay risk score: 71/100. Potential saving: $54. The history tells you everything you need to decide — you do not have to interpret the chart yourself.
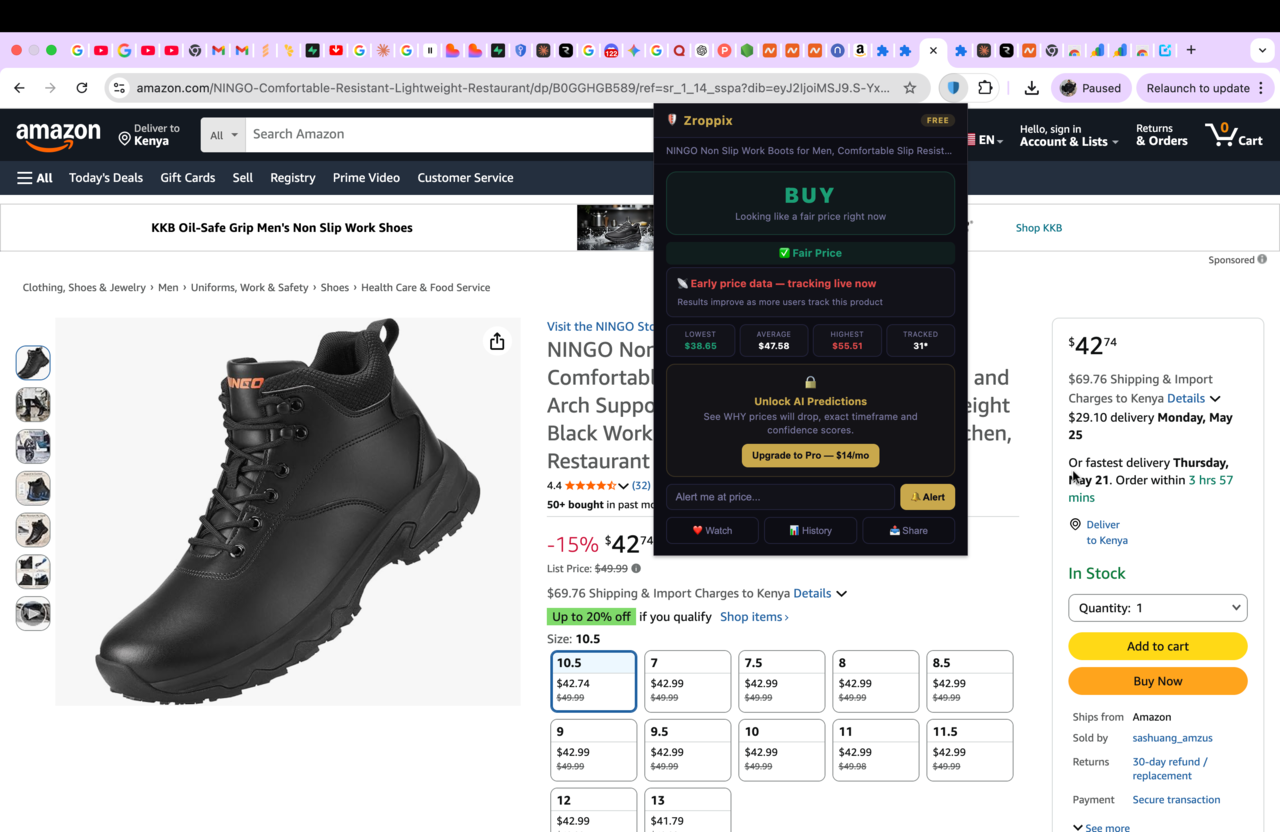
BUY verdict. Current price $42.74 is below the 90-day average of $47.58. The tracked price history confirms this is one of the better prices in the past 90 days — overpay risk score is 18/100. Buy now.
🛡️
See 90 days of price history on any Amazon product
Zroppix tracks prices and tells you instantly whether the current price is good or above average. No chart interpretation. Free. No account. Works on every Amazon product page.
Track Prices Free →
Amazon Price Patterns Over Time — By Category
Amazon Devices
Highly predictable — 30-50% off at every Prime Day and Black Friday
Echo, Kindle, Fire TV, Ring, and Halo all follow the most consistent pattern of any Amazon category. They reach their annual lows at Prime Day (June) and Black Friday (November) every year without exception. List price the rest of the year. Track the current price, set an alert at 30-40% below list, and it will fire at the next event.
Consumer Electronics
Volatile — drops frequently with major lows at Prime Day and Black Friday
Headphones, speakers, cameras, and televisions change price multiple times per week. Major discounts coincide with new model releases (predecessor models drop immediately), Prime Day, and Black Friday. Tracking over time reveals how frequently the specific product you want cycles — some weekly, some only at events.
Best: June + November + New Releases
Laptops
Seasonal — elevated in spring, lowest in late summer and November
Laptop prices are typically at their highest in April-June before new back-to-school models release. Deepest discounts arrive in July-August (Back to School sales) and November (Black Friday). Tracking over time reveals when specific models hit seasonal lows.
Best: July-August + November
Kitchen Appliances
Moderate volatility — post-holiday dip in January and Prime Day discounts
Instant Pot, Ninja, KitchenAid and similar brands see post-Christmas inventory clearance in January as retailers reduce stock. Prime Day delivers meaningful discounts on major brands every year. Tracking over 3-6 months reveals the typical discount depth available.
Best: January + Prime Day
Video Games
Predictable decline — new releases depreciate rapidly over 6-12 months
New game releases start at $60-70 and follow a steep depreciation curve. Tracking over time reveals that most AAA titles drop to $40 within 3 months, $30 within 6 months, and $20 within 12 months. For non-time-sensitive purchases, waiting 3-6 months after release saves 40-60%.
Best: Wait 3-6 months post-release
Fashion / Clothing
Unpredictable — trend and inventory driven, price history less reliable
Fashion prices respond to trends, viral moments, and inventory depletion rather than predictable patterns. Price history tracking is less reliable as a buying signal for fashion compared to electronics or appliances. Best strategy: check current price against 90-day average but apply lower confidence to the signal.
Least Predictable Category
The One Rule Price History Always Confirms
After analyzing thousands of Amazon price histories across every major category, one rule holds with remarkable consistency:
Never buy when the current price is above the 90-day average. The data says wait — and the data is right 83% of the time.
Products priced above their 90-day average return to that average within 30-60 days in the vast majority of cases. The exceptions — products where the price has genuinely shifted to a new higher baseline — are identifiable: the price has been elevated for 60+ consecutive days with no return to previous levels. In that case, the average itself has moved and waiting for the old average is futile.
For everything else: if Zroppix shows a WAIT verdict, the historical data supports waiting. The expected saving of $20-50 per watched item is real money. The time investment is 30 seconds to set the alert. The math is unambiguous.
Start tracking prices today on products you want to buy in the next 3-6 months — not just ones you are buying this week. The more history you build in Zroppix, the more data you have to make precise buying decisions. A product you are considering for your home renovation in August will have 90 days of Zroppix tracking ready when you are ready to purchase.
✓ Free Forever — 90-Day Price History Included
Track any Amazon price over time — start free
Zroppix tracks 90 days of real Amazon price history on any product and gives you an instant BUY or WAIT verdict. See exactly where the current price sits in the historical range — no charts to interpret.
✦ 90-day real price tracking · ✦ BUY or WAIT verdict · ✦ Overpay risk score · ✦ Free price alerts · ✦ Free forever
🛡️ Add to Chrome — It's Free
✓ Free forever
✓ No account needed
✓ Works in 10 seconds
✓ Hourly price updates
✓ 83% prediction accuracy
Your Questions Answered
Tracking Amazon prices over time — complete FAQ
How do I track Amazon prices over time?+
Install Zroppix free from the Chrome Web Store — no account required. Open any Amazon product and click the shield icon to see 90 days of real price history instantly. For multi-year historical data, go to camelcamelcamel.com, paste the Amazon product URL, and view the full historical chart. Both are free. Zroppix is faster and gives you a verdict; CamelCamelCamel goes back further.
How far back does Amazon price history go?+
Amazon itself shows no price history at all — they hide it deliberately. Third-party tools vary: Zroppix shows 90-day history, CamelCamelCamel shows history going back to when they first tracked a product (up to 10+ years for popular items), and Keepa provides multi-year data with sales rank. For most buying decisions, 90 days of history is sufficient to determine if the current price is good or above average.
Why do Amazon prices change so much over time?+
Amazon uses a dynamic pricing algorithm making approximately 2.5 million price changes per day. Prices respond to competitor pricing, your individual browsing and purchase history, inventory levels, time of day, upcoming sale events, and broader demand signals. The same product can vary $30-100 across different times, users, and browsing contexts — which is exactly why tracking over time reveals patterns that a single snapshot cannot.
What is the best free tool to track Amazon prices over time?+
For regular shoppers who want an instant answer, Zroppix is best — it tracks 90-day history and delivers a BUY or WAIT verdict without any chart interpretation. For multi-year historical data and unlimited price alerts, CamelCamelCamel is the best free alternative. For professional sellers who need sales rank data alongside price history, Keepa is the industry standard.
What does Amazon price history reveal that you cannot see on the product page?+
Price history reveals four things Amazon hides: whether the current price is actually good relative to recent history; how often the price drops and by how much; whether sale badges are genuine discounts or manufactured from inflated reference prices; and the seasonal patterns for when specific product categories reach their lowest prices each year. None of this is visible on the Amazon product page itself.
How do I know if an Amazon price is at a historical low?+
Open the product in Zroppix — the popup shows the 90-day lowest, average, and highest price immediately. If the current price matches the 90-day low, you are at a recent historical low. Zroppix also shows the overpay risk score (0-100) — a score below 20 indicates the price is near its recent low. For longer-term historical lows going back years, check CamelCamelCamel.
Do Amazon prices go down over time for most products?+
It depends on category. Electronics generally trend downward as new models release and older models get discounted — but with significant short-term volatility. Amazon devices cycle seasonally between list price and deep discounts. Fashion is unpredictable. For most electronics and appliances, the 90-day window captures the meaningful range for a buy or wait decision. For longer-term trends, CamelCamelCamel's multi-year charts show the full picture.